Monitoring with Prometheus, Grafana, & PVE Exporter in LXC Containers
A wacky guide on setting up Prometheus, Grafana, and PVE Exporter within Proxmox containers to monitor and visualize homelab peformance to make sure your homelab is behaving!
Is this thing on? 🎤
Hi! It’s me again! It’s been a wild month and I know I say that but this time it was even more wilder I promise lol. I got back from a two week vacation in Japan and it was by far the BEST trip I have ever taken. Unfortuntely, we got back and it was back to back family problems/death and yeah.. not fun! Anyways, things are better now and I gave my negelected homelab some much needed love in the form of monitoring and updates of course! As you know, I have my proxmox instance, UnRaid, and my pihole running as my homelab. I did not have a way to monitor them all at once so I dediced to fix that by using a classic stack:
- Prometheus for metric collection
- Grafana for visualization
- prometheus-pve-exporter to brdige the gap between Prometheus and the Proxmox API.
I decided to play with LXC containers this time to keep a clean and modular setup leveraging Proxmox VE scripts which are fantastic!
Updated Homelab Architecture Diagram 🏛️

Before we start, I wanted to drop this updated diagram of my network! I finally got the UnRaid NAS setup with a couple docker containers! You might notice I also added the LXC containers. There are three LXC containers that I created using Debian. The first one is prometheus, which is the prometheus server and what allows me to gather all the information about each server. The second is grafana which is the UI and all the visualizations from the data we feed from Prometheus. Lastly, the third LXC container is the pve-exporter which scrapes information off of the proxmox node and sends it over to Prometheus.
To summarize,
- LXC #1 - prometheus server: centralized location for all data being collected
- LXC #2 - Grafana: visualizations for the all the data from prometheus
- LXC #3 - pve-exporter: Proxmox exporter polling api
Proxmox VE Helper-Scripts
Let me pass on knowledge I wish I knew before this mini project.
This will save you HOURS of time and troubleshooting (at least for me). These scripts will automatically create the containers for you and will install all the neccassary libraries and dependencies. All that will need to be done is configuration which is straightforward!
Architecture and Planning
The decision to use LXC containers rather than a full VM was due to resource efficiency. Each monitoring component will have it’s own container, providing isolation and minimizing overhead. You can run all the components in one container and it would work fine but personally I like to keep them separated and it simplifies backup/migration.
For each container I assigned the default storage, ram, and cores which are:
- Prometheus Container: 1 CPU Cores, 2GB RAM, 4GB Storage
- Grafana Container: 1 CPU Cores, 512MB, 2GB Storage
- PVE Exporter: 1 CPU Cores, 512MB, 2GB Storage
You are welcome to assign more but I found the defaults to be fine! I am still working on figuring out data retention however I just have real time monitoring setup at the moment.
Installation Process Using Proxmox VE Scripts
Prometheus Setup
I cannot say this enough but the Proxmox VE community is amazing at providing these excellent scripts to streamline the process. You will need to run this
1
bash -c "$(curl -fsSL https://raw.githubusercontent.com/community-scripts/ProxmoxVE/main/ct/prometheus.sh)"
This script handles the LXC container creation and the Prometheus installation process. Pretty nifty huh? In a span of 5 minutes it created:
- Creates an optimized LXC container
- Grabs latest Prometheus release and installs it
- Configures systemd service files
- Setups proper directory permissions
- Provides barebones prometheus.yml configuration.
Post installation, I customized the yaml file located in /opt/prometheus/prometheus.yml. I went an added my proxmox and unraid instance inside the configuration however this will not work until the PVE Exporter is setup, so we are going a bit out of order here.
1
2
3
4
5
6
7
8
9
10
11
12
13
14
15
16
17
global:
  scrape_interval: 15s
  evaluation_interval: 15s

scrape_configs:
  - job_name: "prometheus"
    static_configs:
      - target: ["localhost:9090"]

- job_name: "pve-exporter"
    static_configs:
    - targets: [EXPORTERIP]

- job_name: 'unraid'
    static_configs:
      - targets:
        - UNRAIDIP:PORT
The Prometheus installation is straightforward. Let’s move on to the PVE-Exporter as it’s a bit more involved.
PVE Exporter Deployment
Similar to Prometheus, this script will do all the heavy lifting for you. Just verify the script source is legit and run it in your Node’s Terminal.
1
bash -c "$(curl -fsSL https://raw.githubusercontent.com/community-scripts/ProxmoxVE/main/ct/prometheus-pve-exporter.sh)"
Now, that we have the Container set up we will need to create a dedicated monitoring user in Proxmox. This can be done either in the CLI or the interface. For this example, I will go through the UI method.
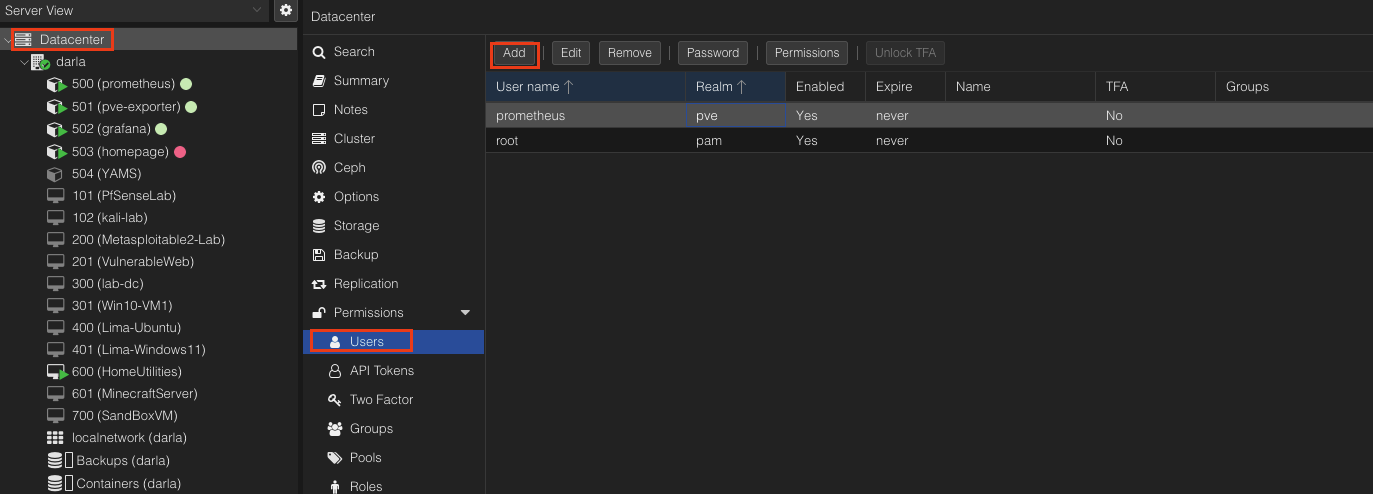
Navigate over to Datacenter -> Users -> Add. Enter a useraname. I choose prometheus and then change the Realm to Linux PAM Standard Authentication. Hit Add.
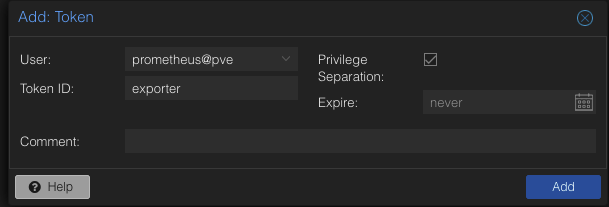
Navigate over to API Tokens -> Add. Select the user we just created. Enter a token ID, I just used exporter. Leave everything else default and click Add. You will see a window providing you a secret. Make note of that secret because you won’t see it again unless you create it again! We will need it for the later parts!
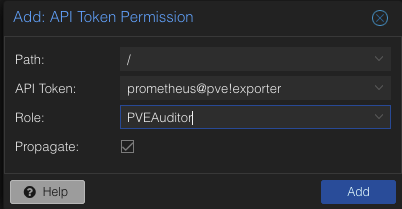
Now, we will head over to Permissions -> Add and click API Token Permission. Select your token and ensure we assign the PVEAuditor role this will allow prometheus to gather data about all our VMS and Containers.
Now we that have our api token user set up, we will navigate back over to our container terminal. Enter the following:
1
  nano /opt/prometheus-pve-exporter/pve.yml
This will bring up our PVE Exporter yaml where we will enter the token. Remember earlier I told you to make note of that secret? You will now need it here!
1
2
3
4
5
default:
    user: prometheus@pve
    token_name: "exporter"
    token_value: "THESECRETVALUE"
    verify_ssl: false
Save the yaml file and that’s all we need to do for Promethus and the PVEExporter. You can navigate over to the Prometheus UI at http://PROMETHEUSIP:9090/targets. If everything is working well, you should see your Proxmox instance with the state as UP. Now, let’s move on to setting up Grafana so we can visualize the data.
Grafana Installation
Just like clockwork we are using the community script:
1
bash -c "$(curl -fsSL https://raw.githubusercontent.com/community-scripts/ProxmoxVE/main/ct/grafana.sh)"
Similar to Prometheus, the script will configure Grafana with the default settings. Once it’s all setup you can access it via http://GRAFANAIP:3000. You should see a login page. Use these credentials to login and change them
Username: admin Password: admin
Grafana Data Source Configuration
Now we need to connect Frafana to Prometheus. This is down by the following:
- Navigate to
Connections -> Data Sources - Click
Add new data sourceand add the Prometheus Data Source. - Give it a name. I kept it simple and did prometheus
- Under Connection -> Prometheus server URL. Enter your Prometheus Container IP address.
- Scroll down to the bottom and Click
Save & Test
Awesome! We now have our data source connected to Grafana. Now we need to get a dashboard to visualize it.
- Navigate to
Dashboards -> New -> Import - In the textbox asking for dashboard URL or ID enter
10347 - Click Load.
- Name it anything you like! I left it default.
- Select your prometheus data source. Should only be the one you added.
Navigate over to Dashboards and you should see the dashboard with all the data visualized into nice graphs! Feel free to play around and edit the dashboard to your hearts desire.
Key Metrics Being Monitored
- CPU utilization per node and VMs
- Memory Usage/Allocation
- Storage Consumption
- Network traffice and Interface Statistics
- VM Status and resource allocation
Conclusion
I hope you enjoyed this post about setting up monitoring for your proxmox instance. This can be expanded to include any other services/servers you might have! I added my unraid NAS and I have a dashboard to monitor it as well. I know you can setup alerting but I have not gotten that far as I have alot going in my life at the moment. If you have any questions feel free to message me or drop a comment below! Until next time!